 Rebel Dietitian Dana McDonald, RD
 Per request, here is an explanation of the different technical indicators and overlays I use on my charts. You can learn more about each indicator by searching for it via StockCharts.com; which, is the charting software I use.
Hope this helps!
Dana
BTW, I don’t post on my other social media accounts anymore so don’t follow me there. Burn out.
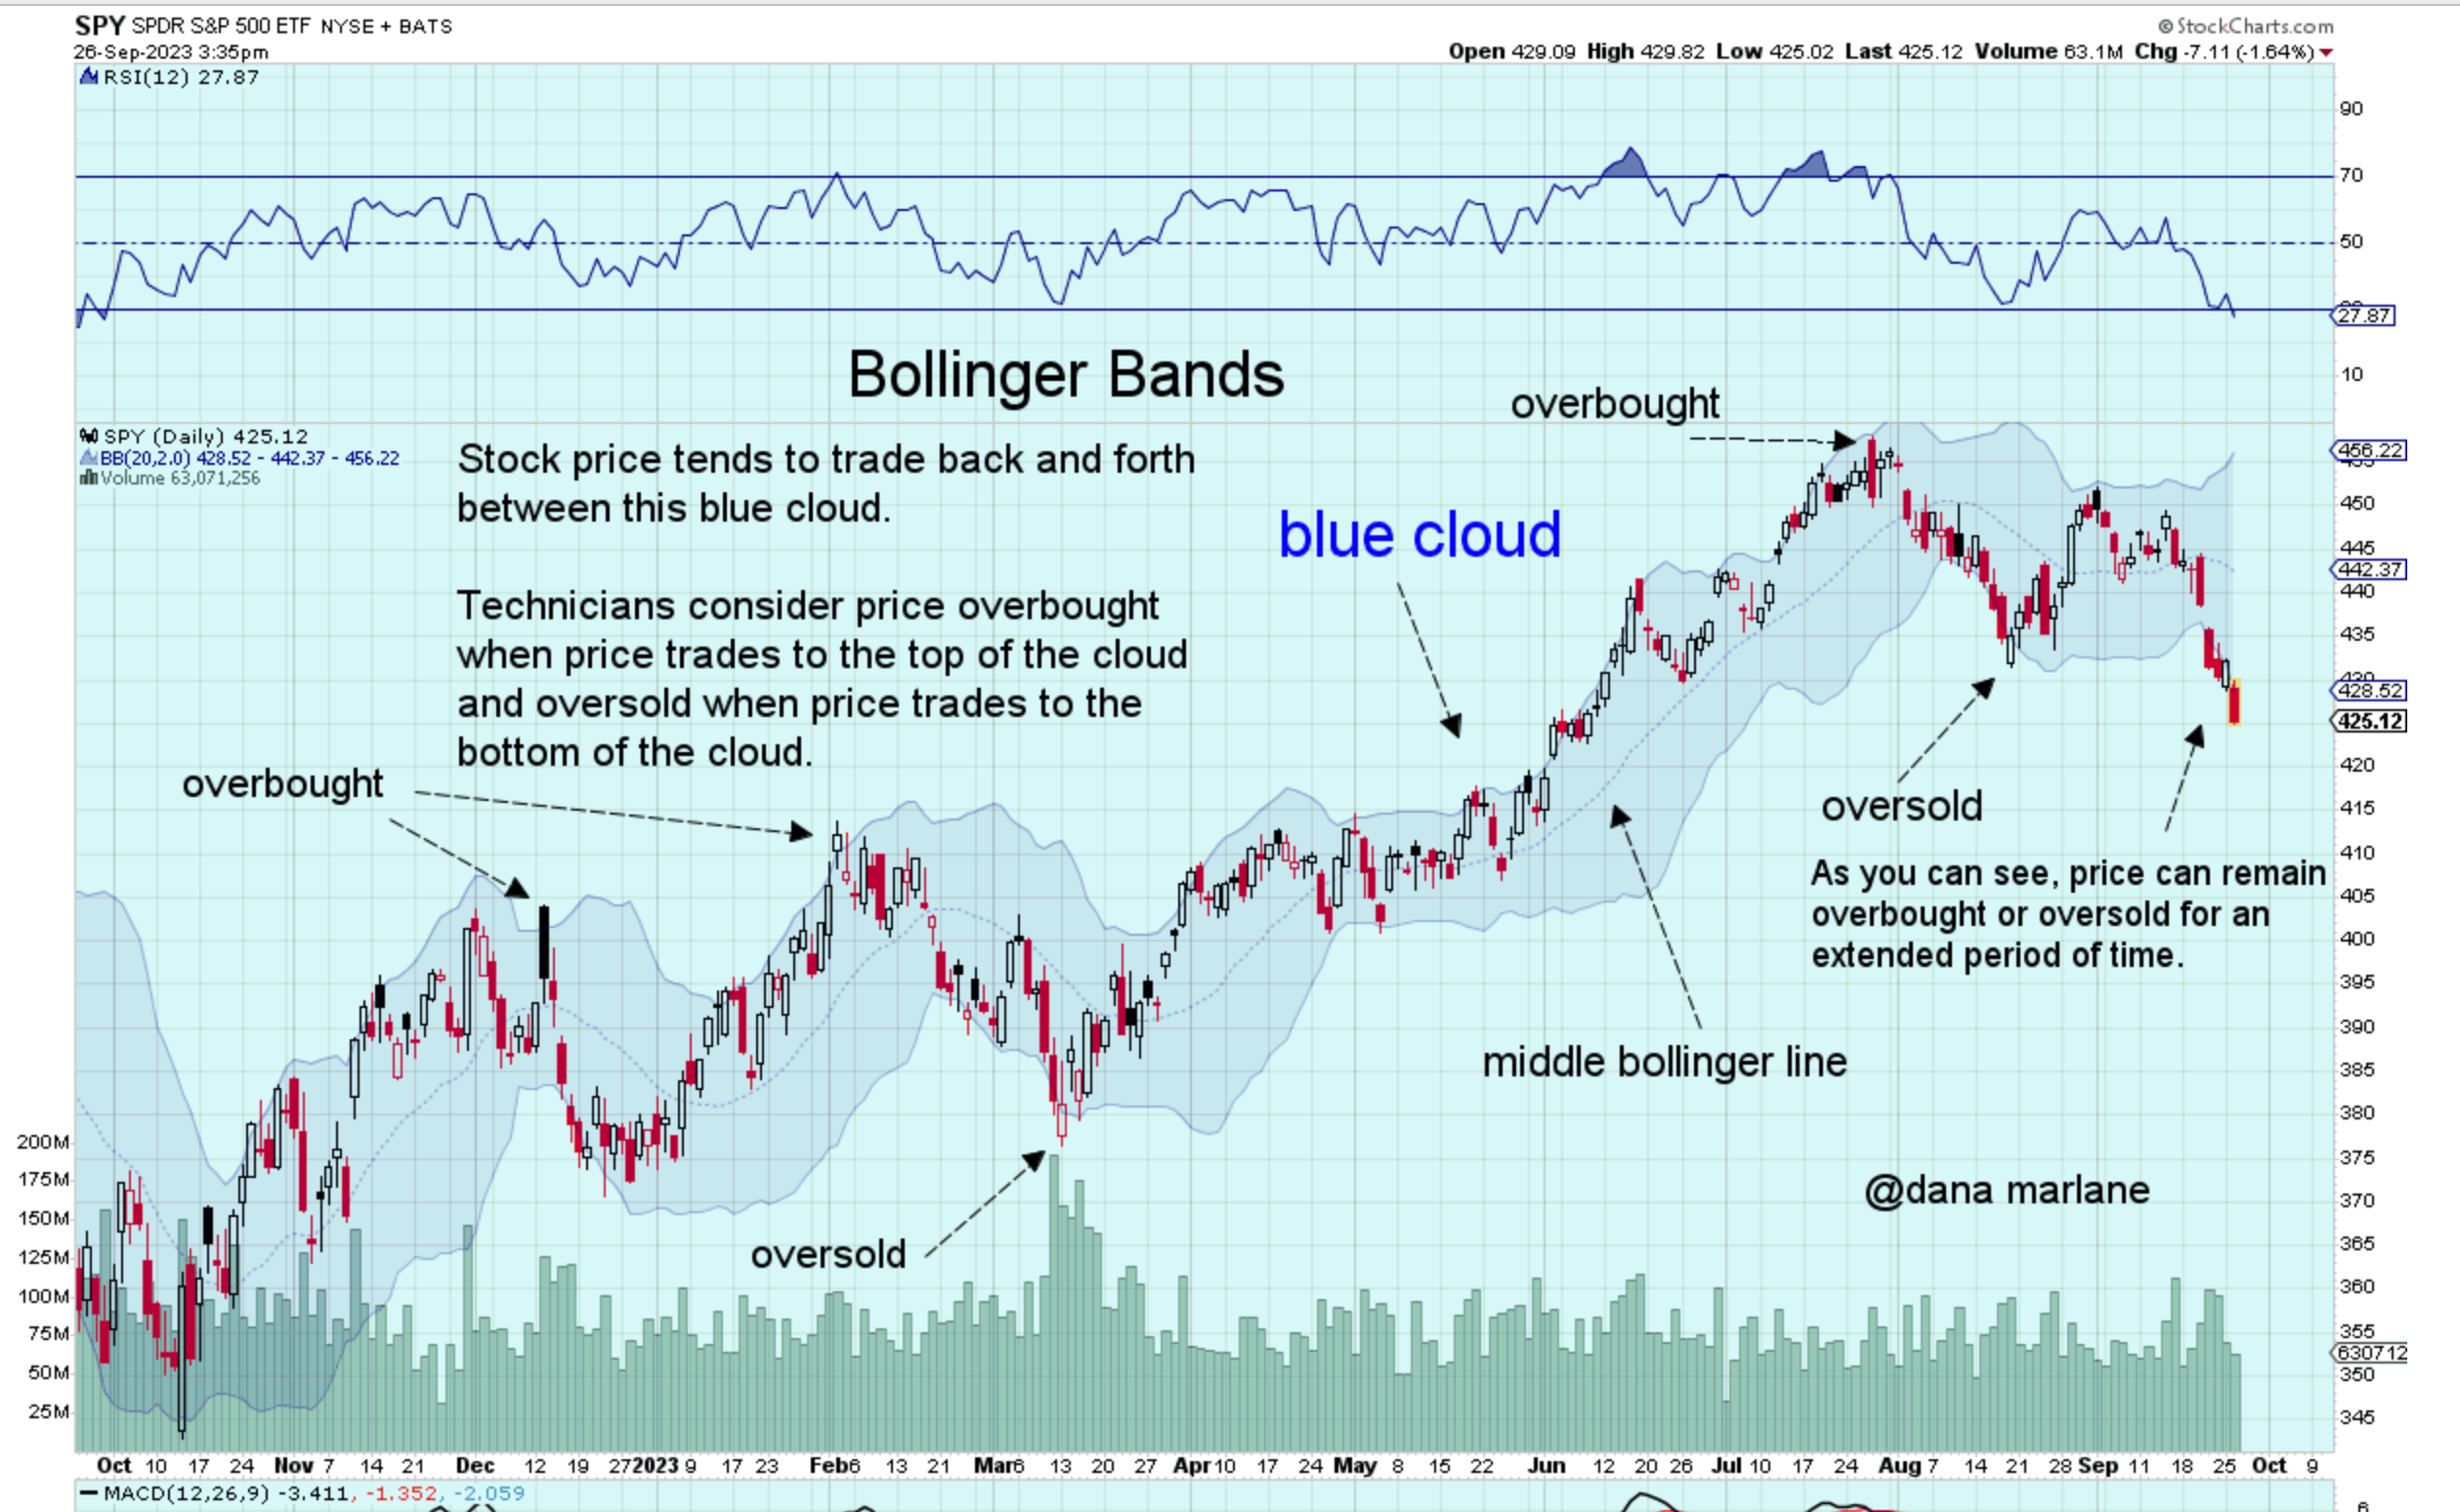
Bollinger Bands
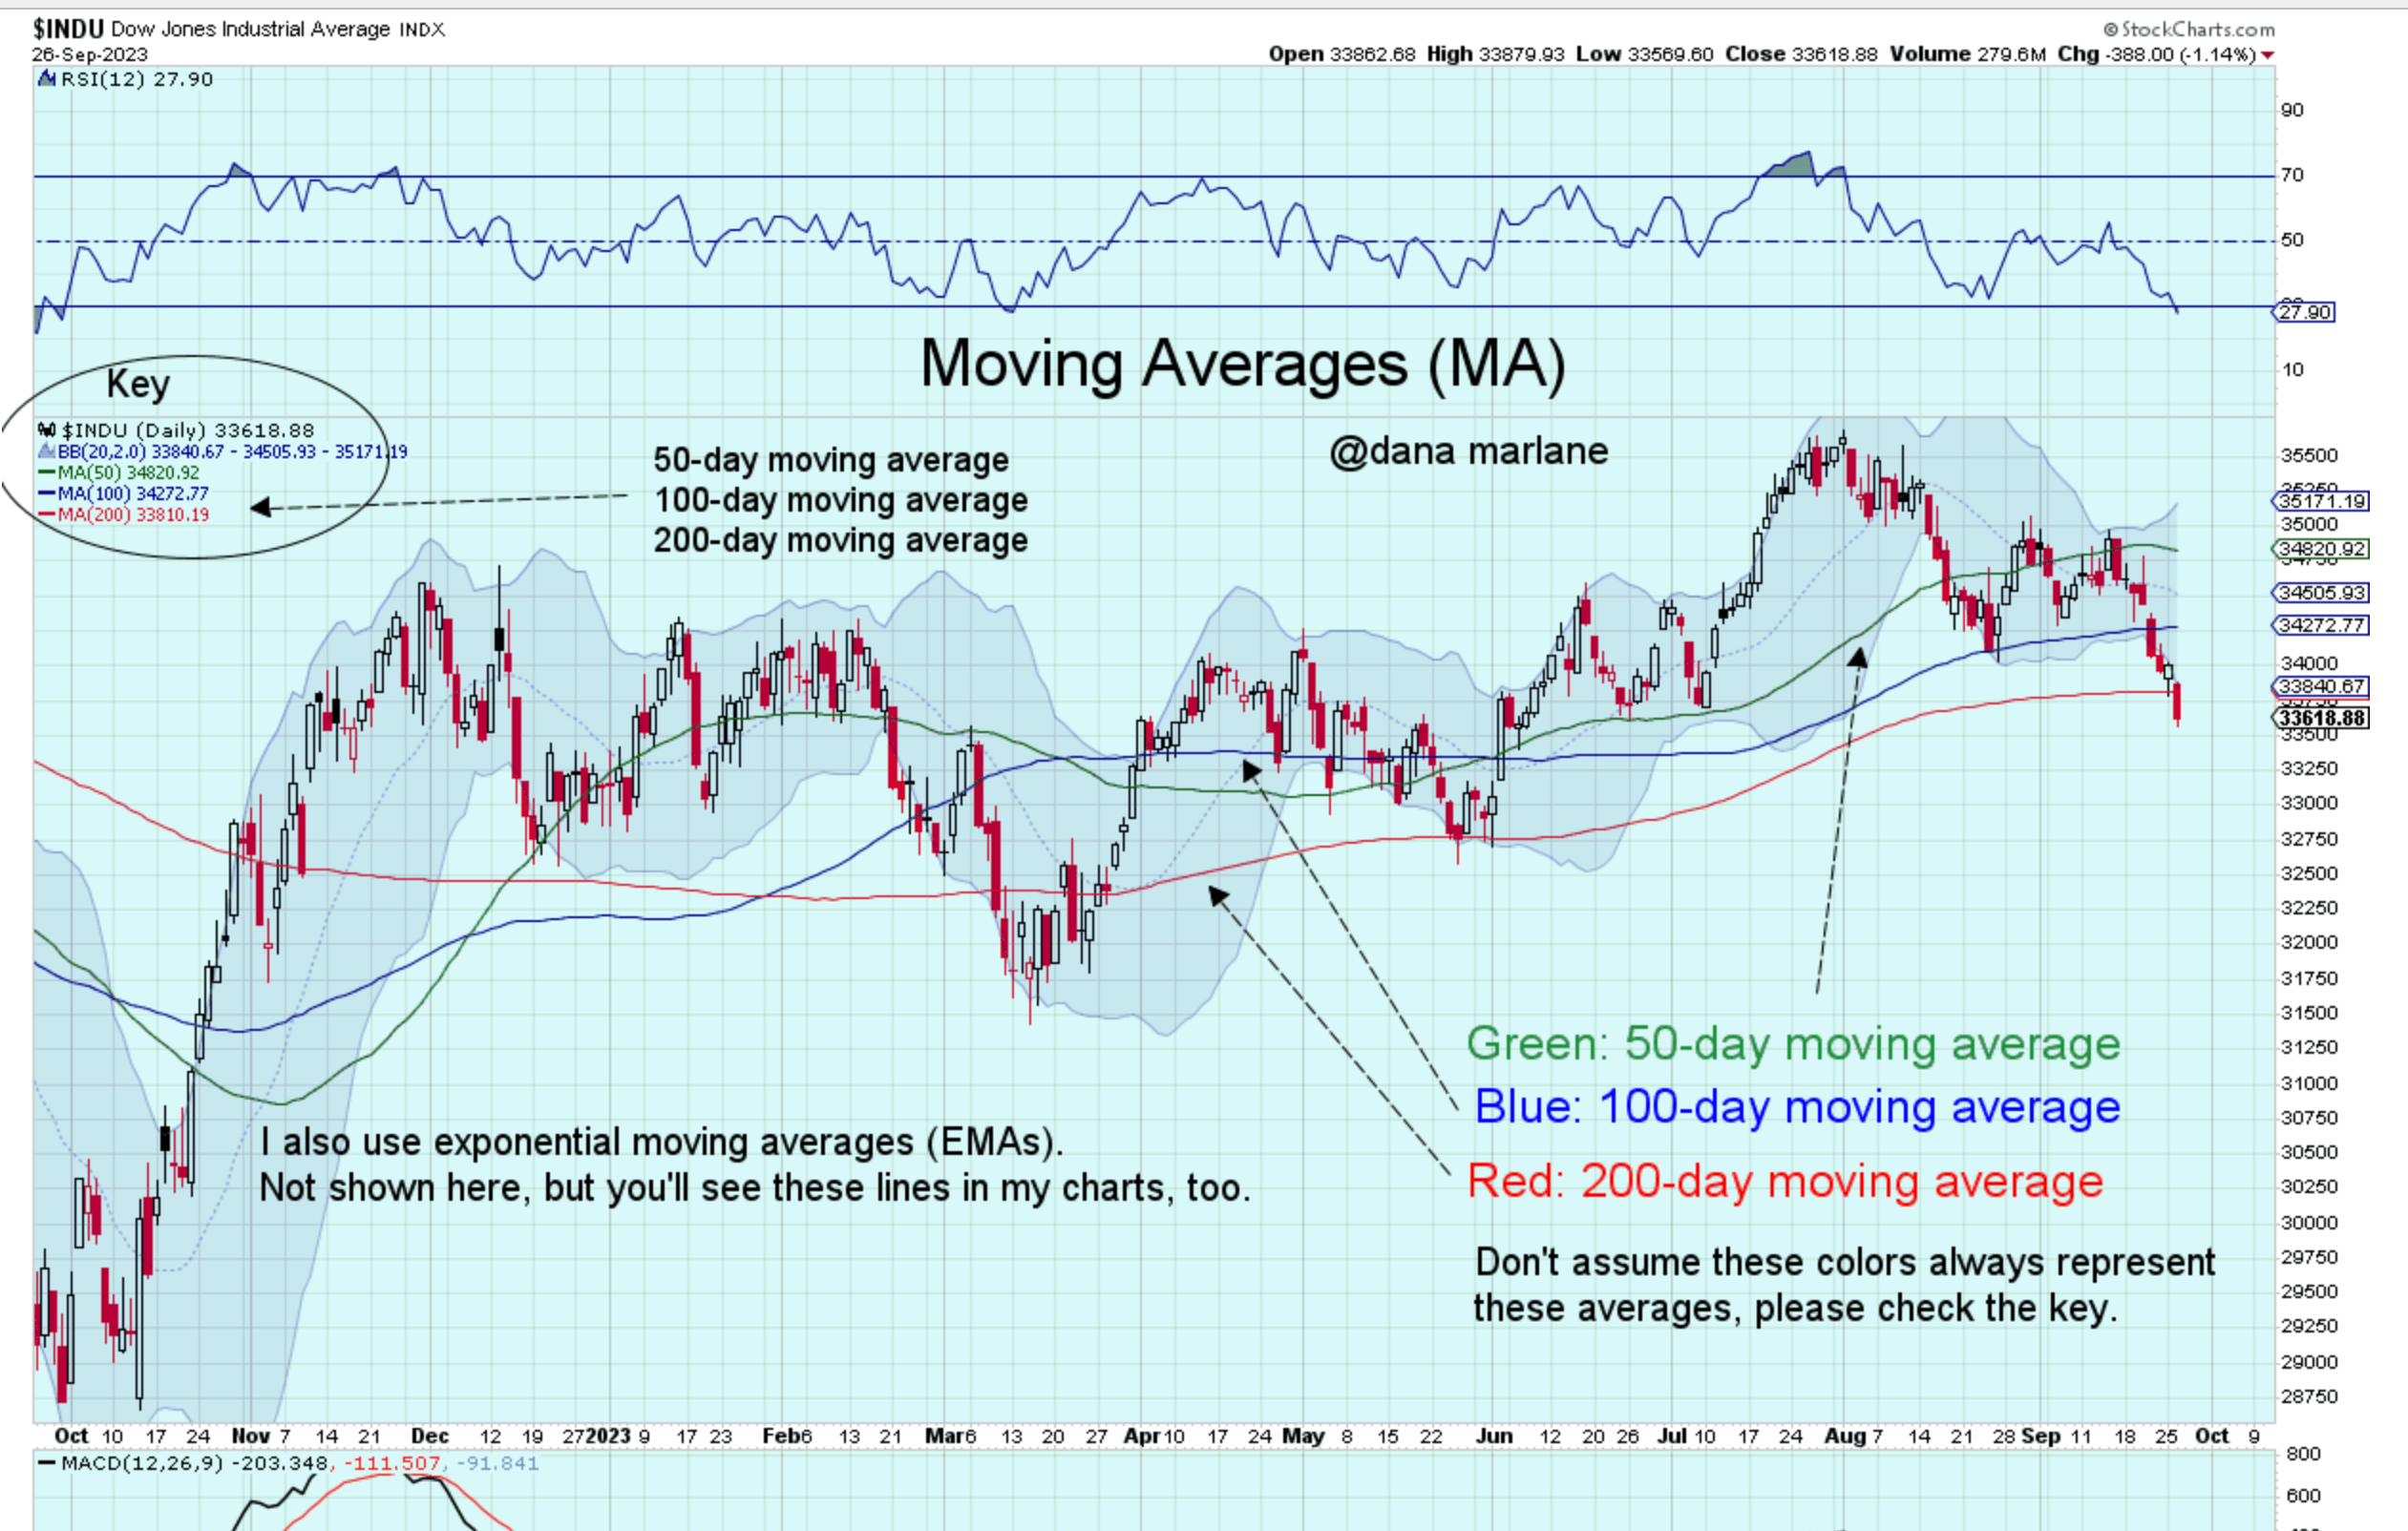
Moving Averages
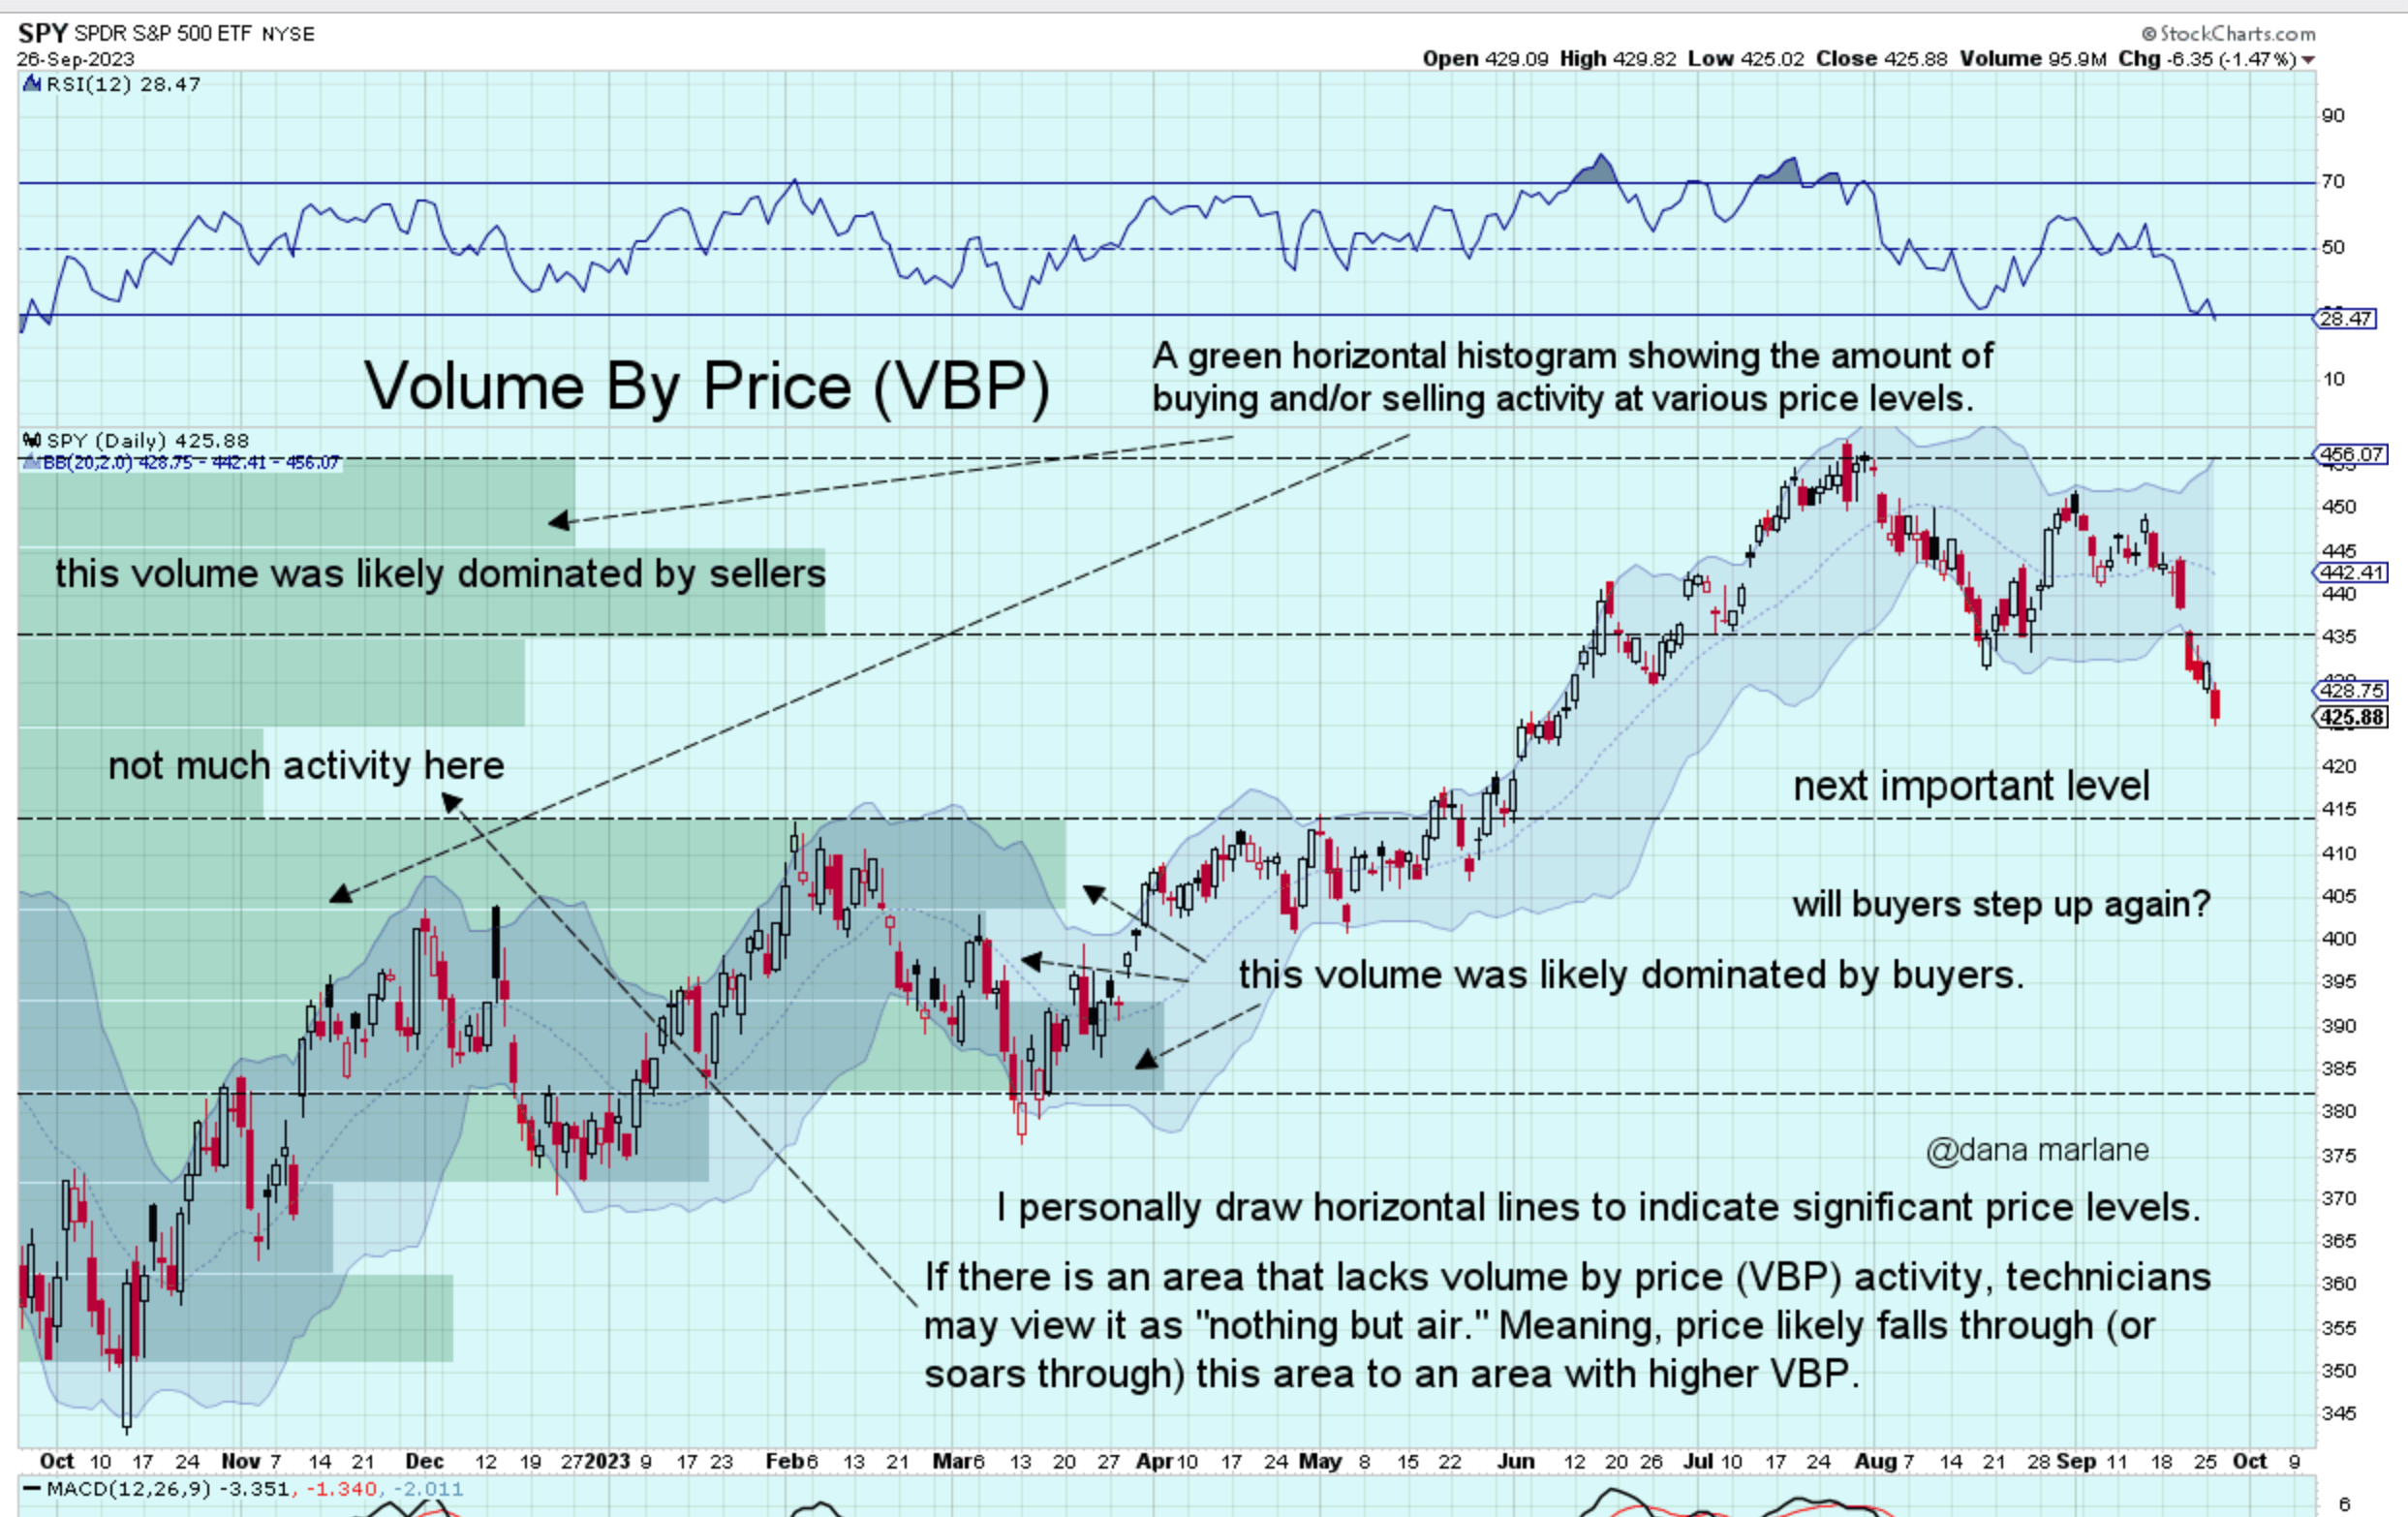
Volume By Price
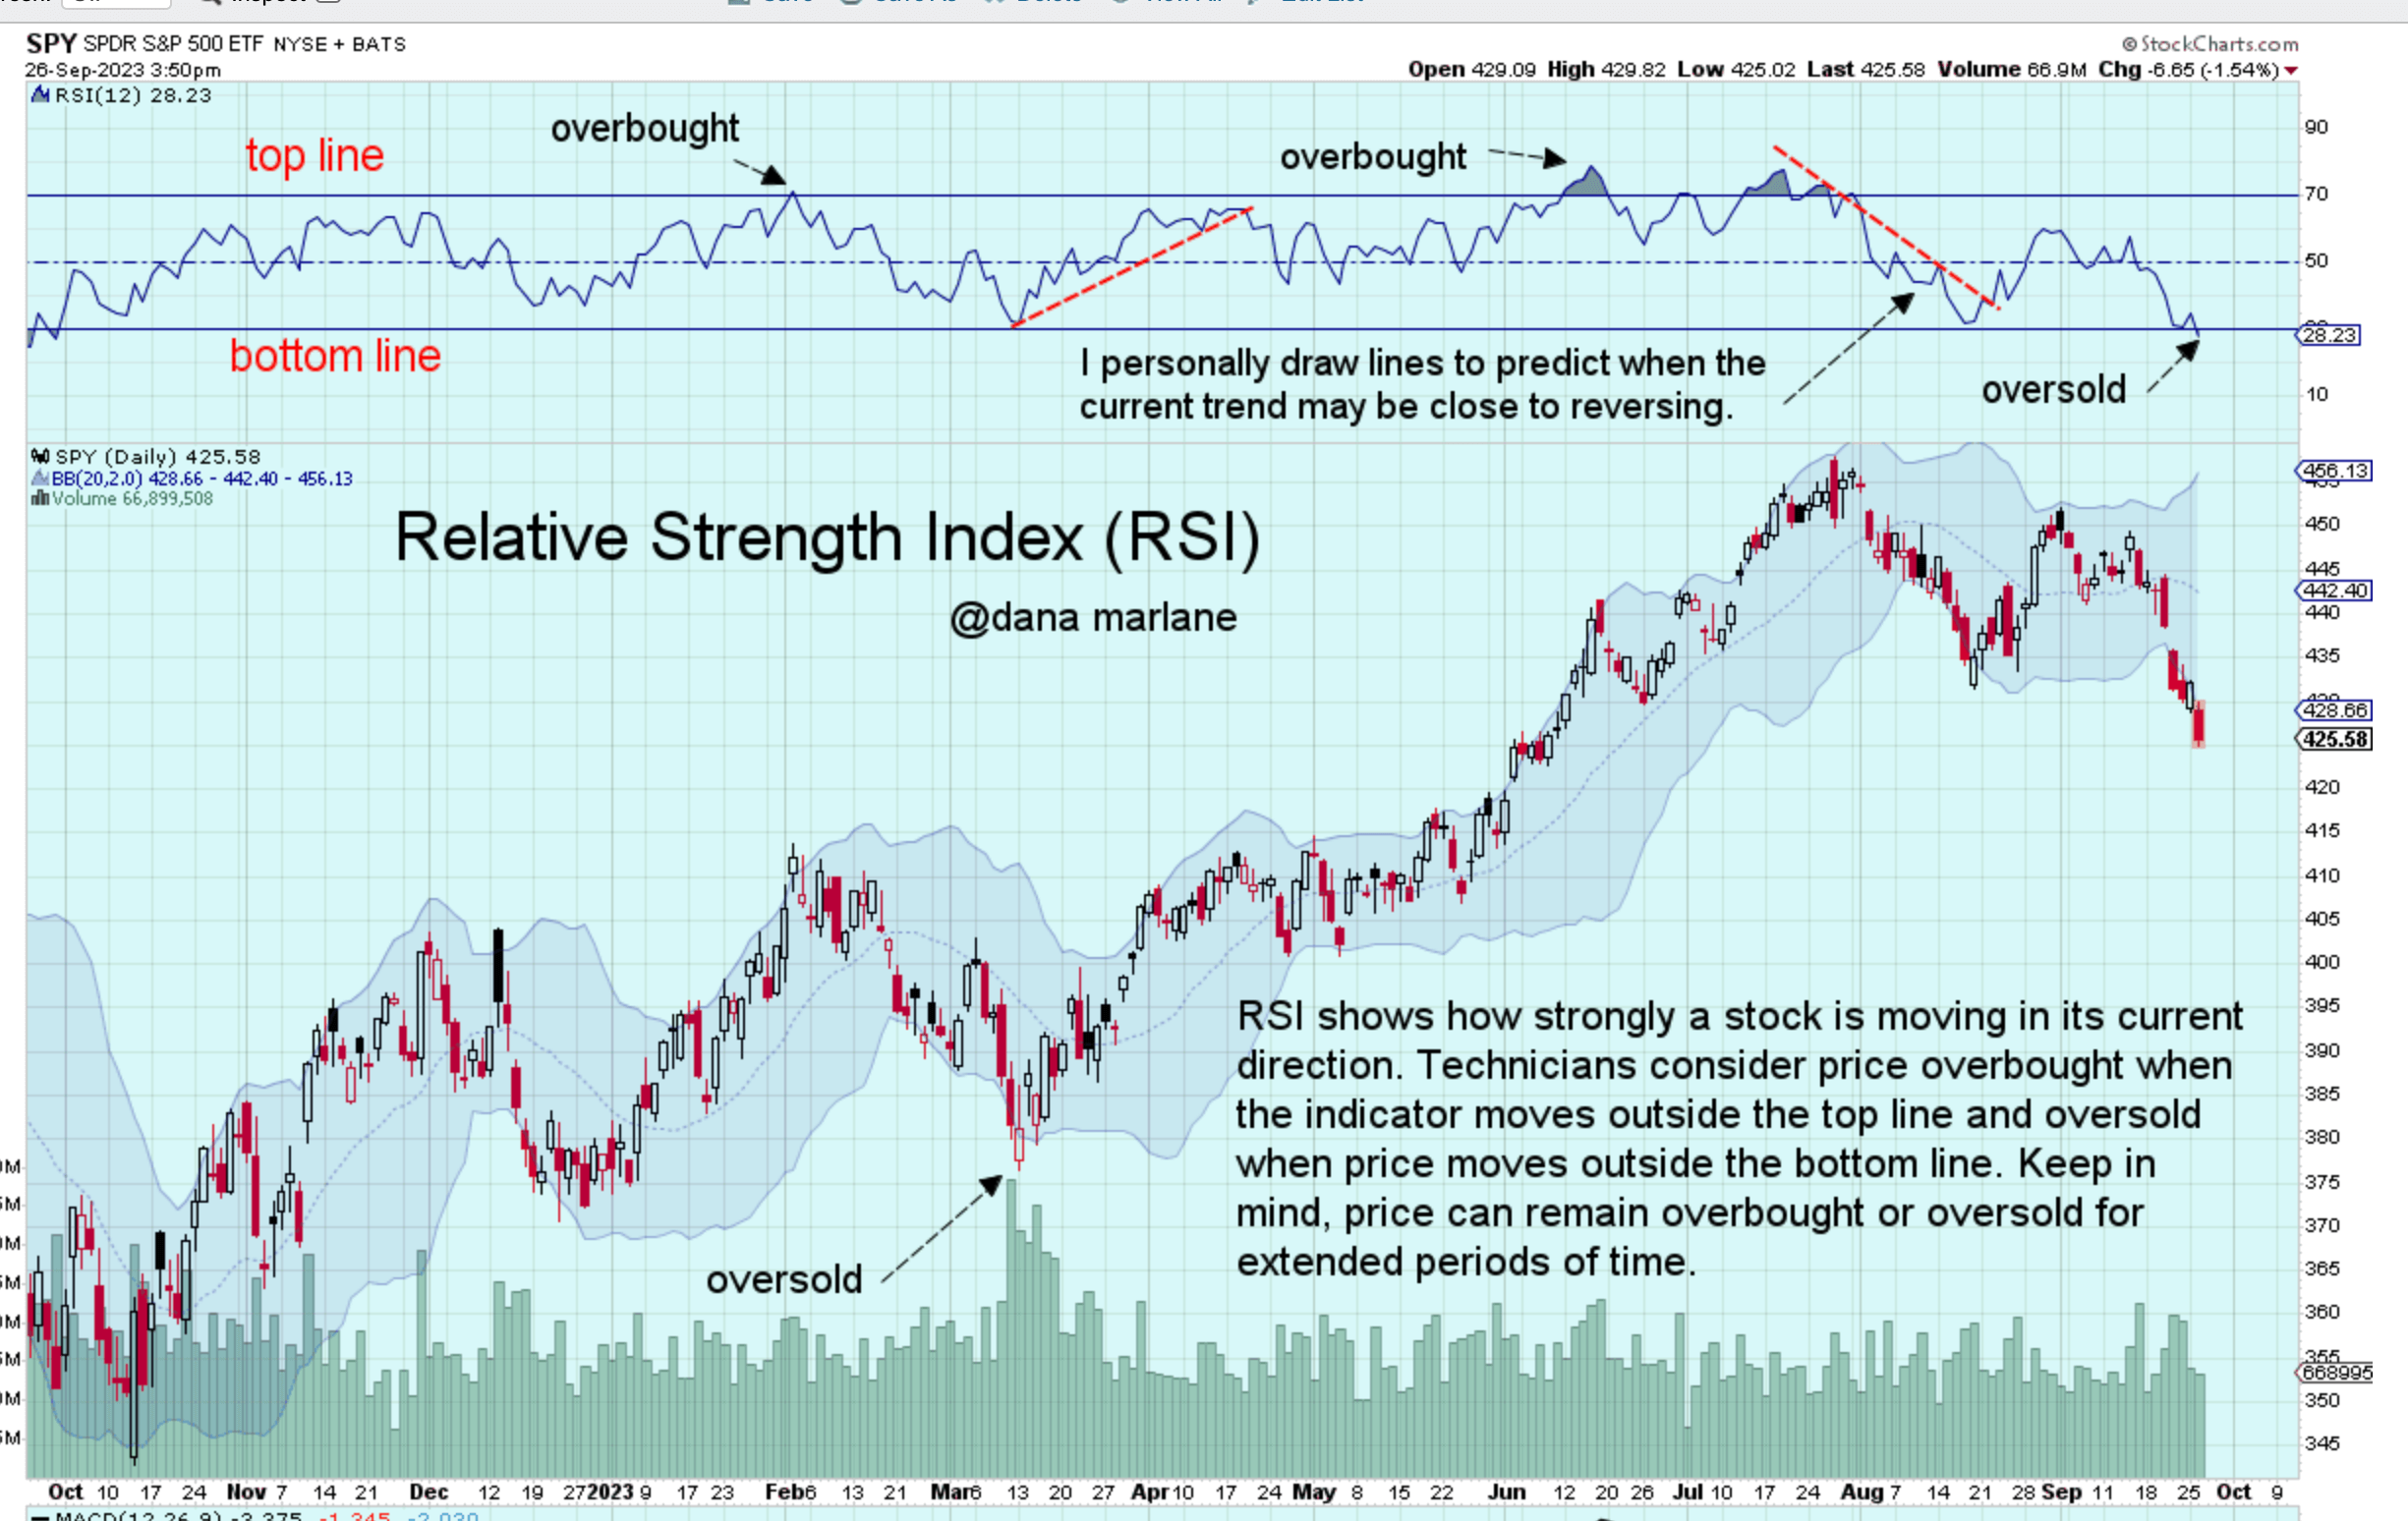
Relative Strength Index (RSI)
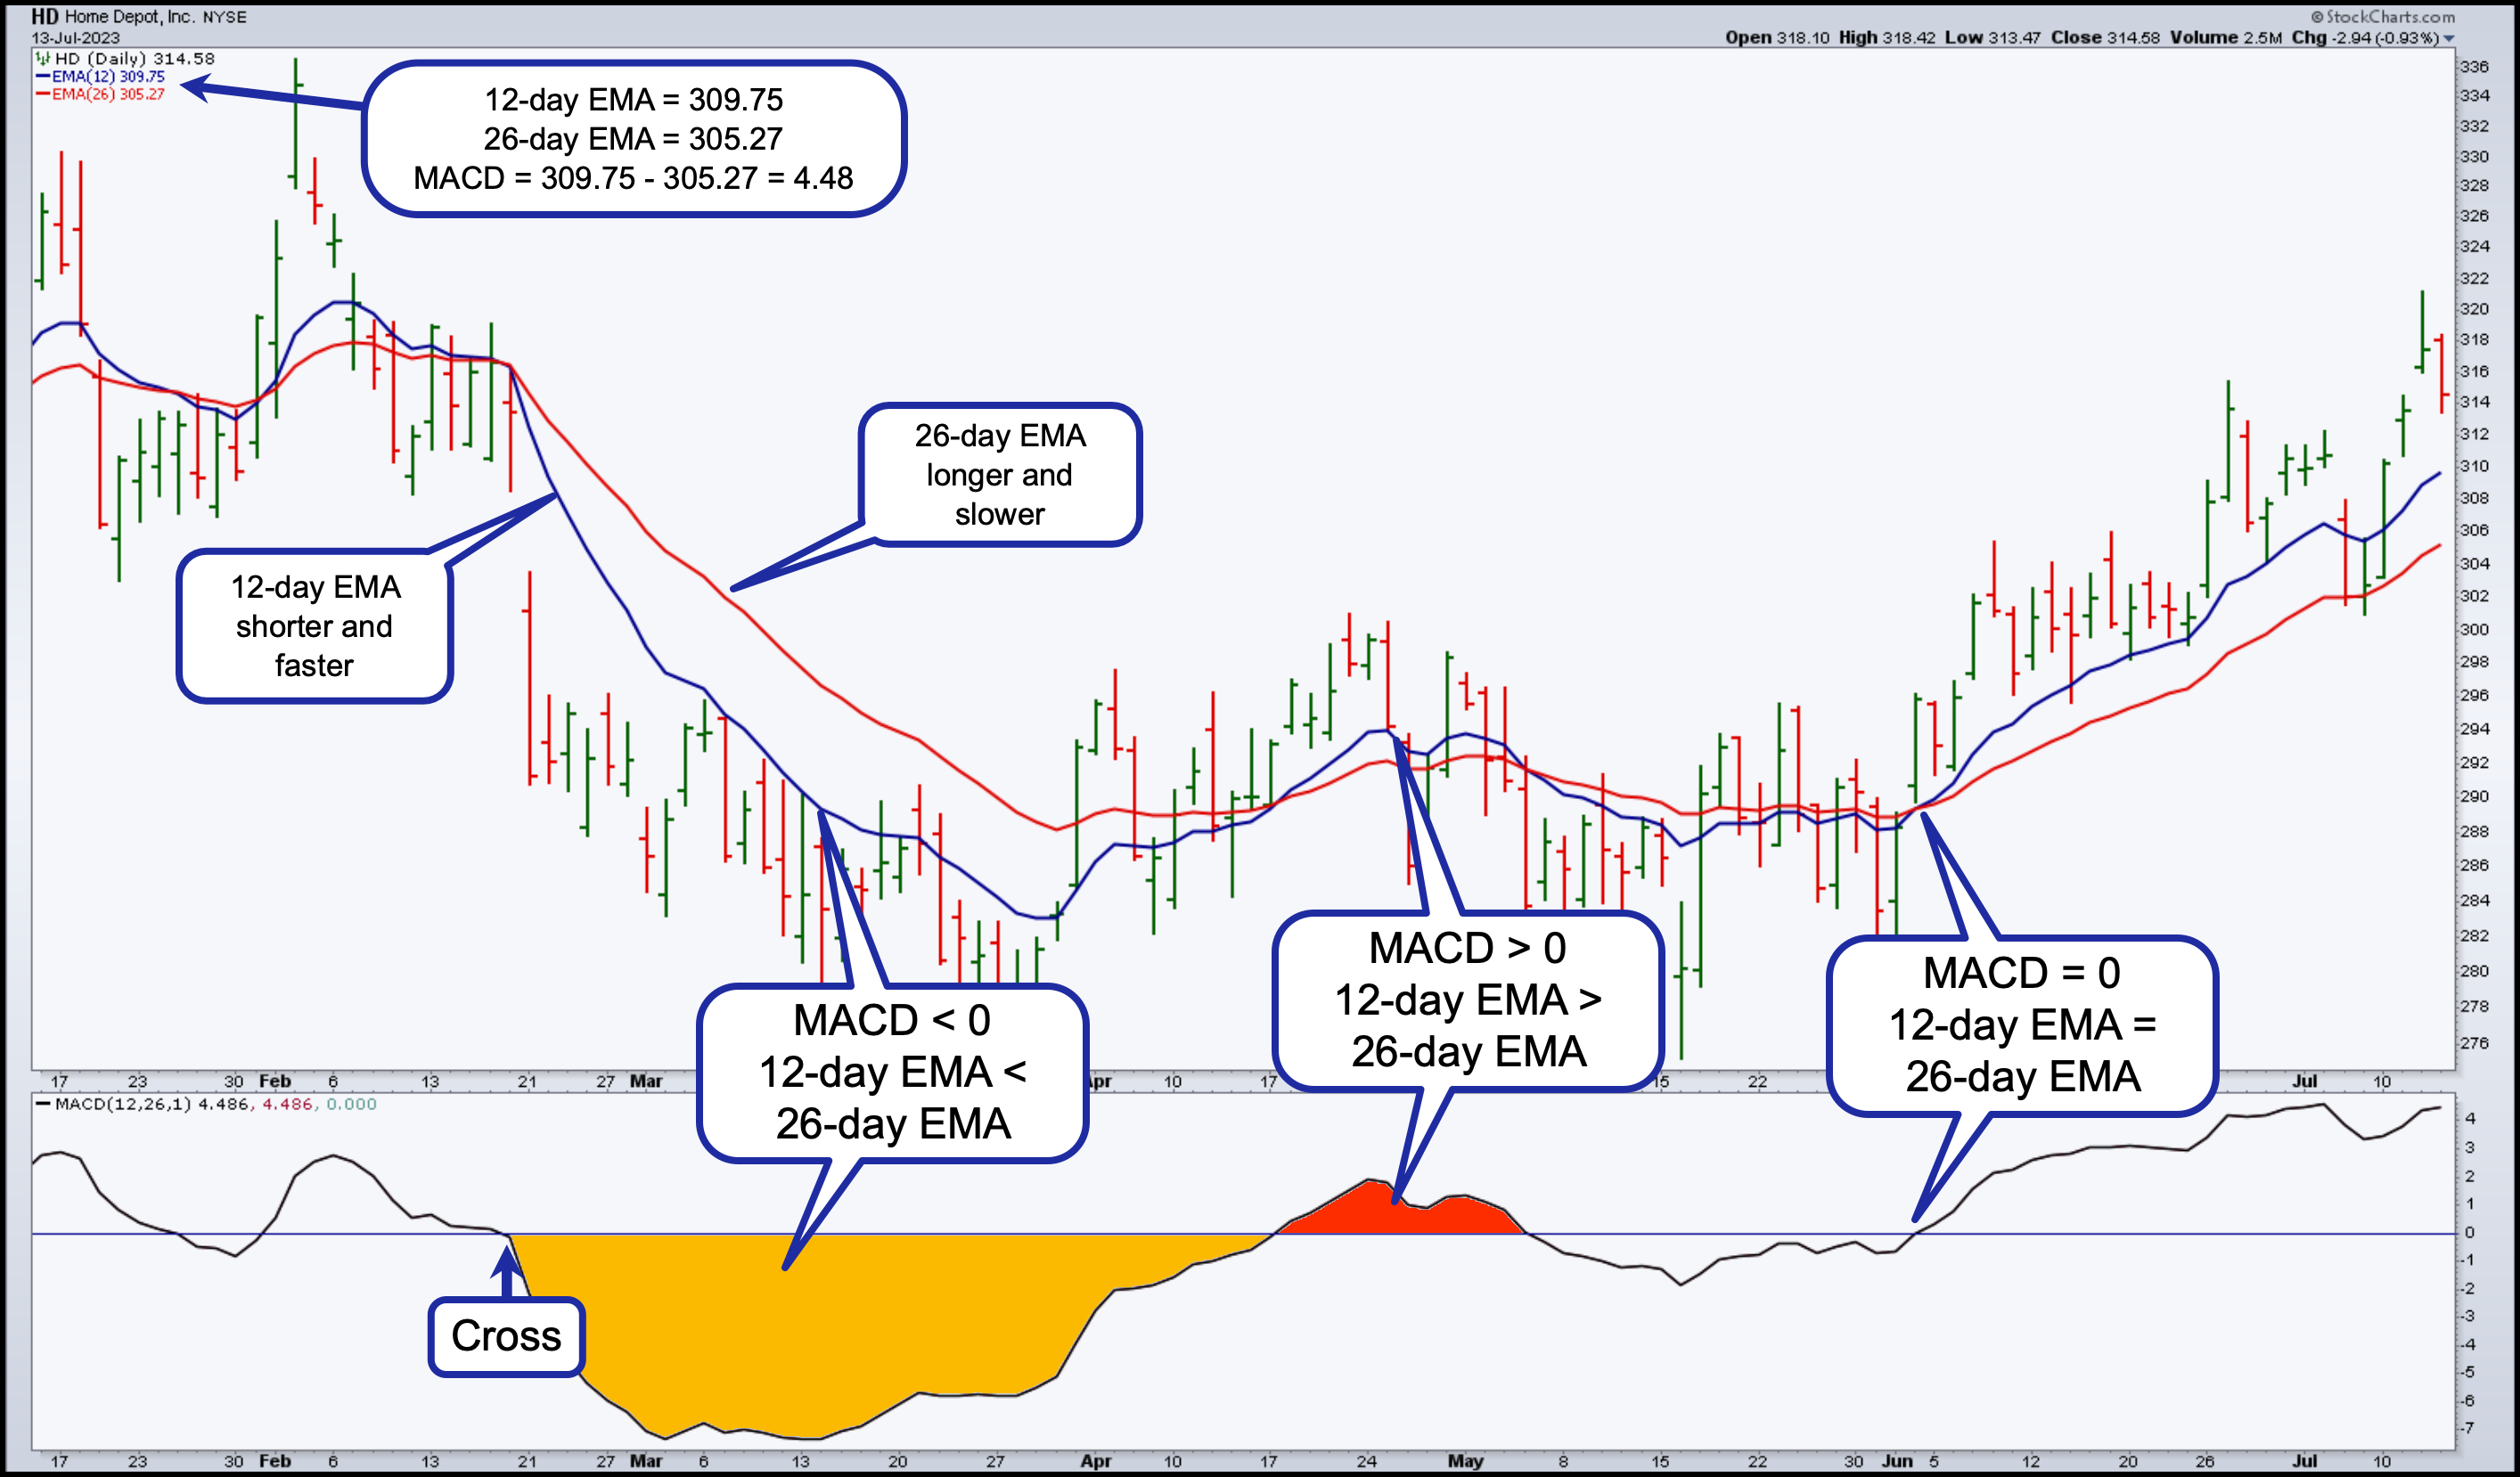
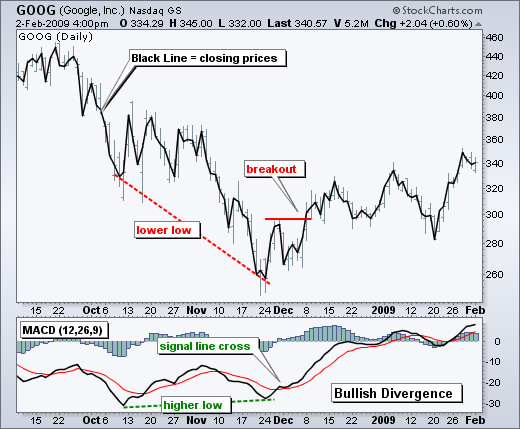
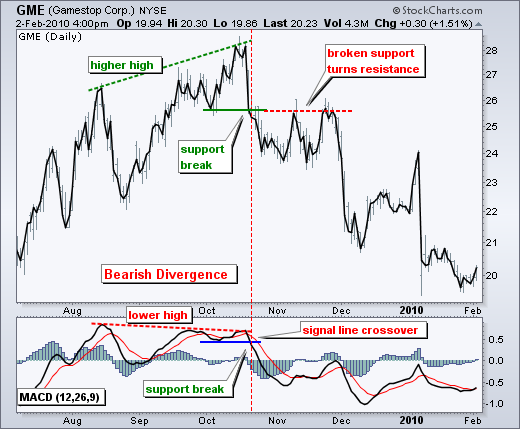
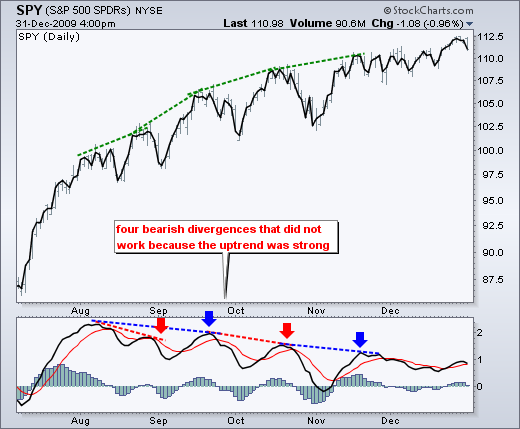
MACD
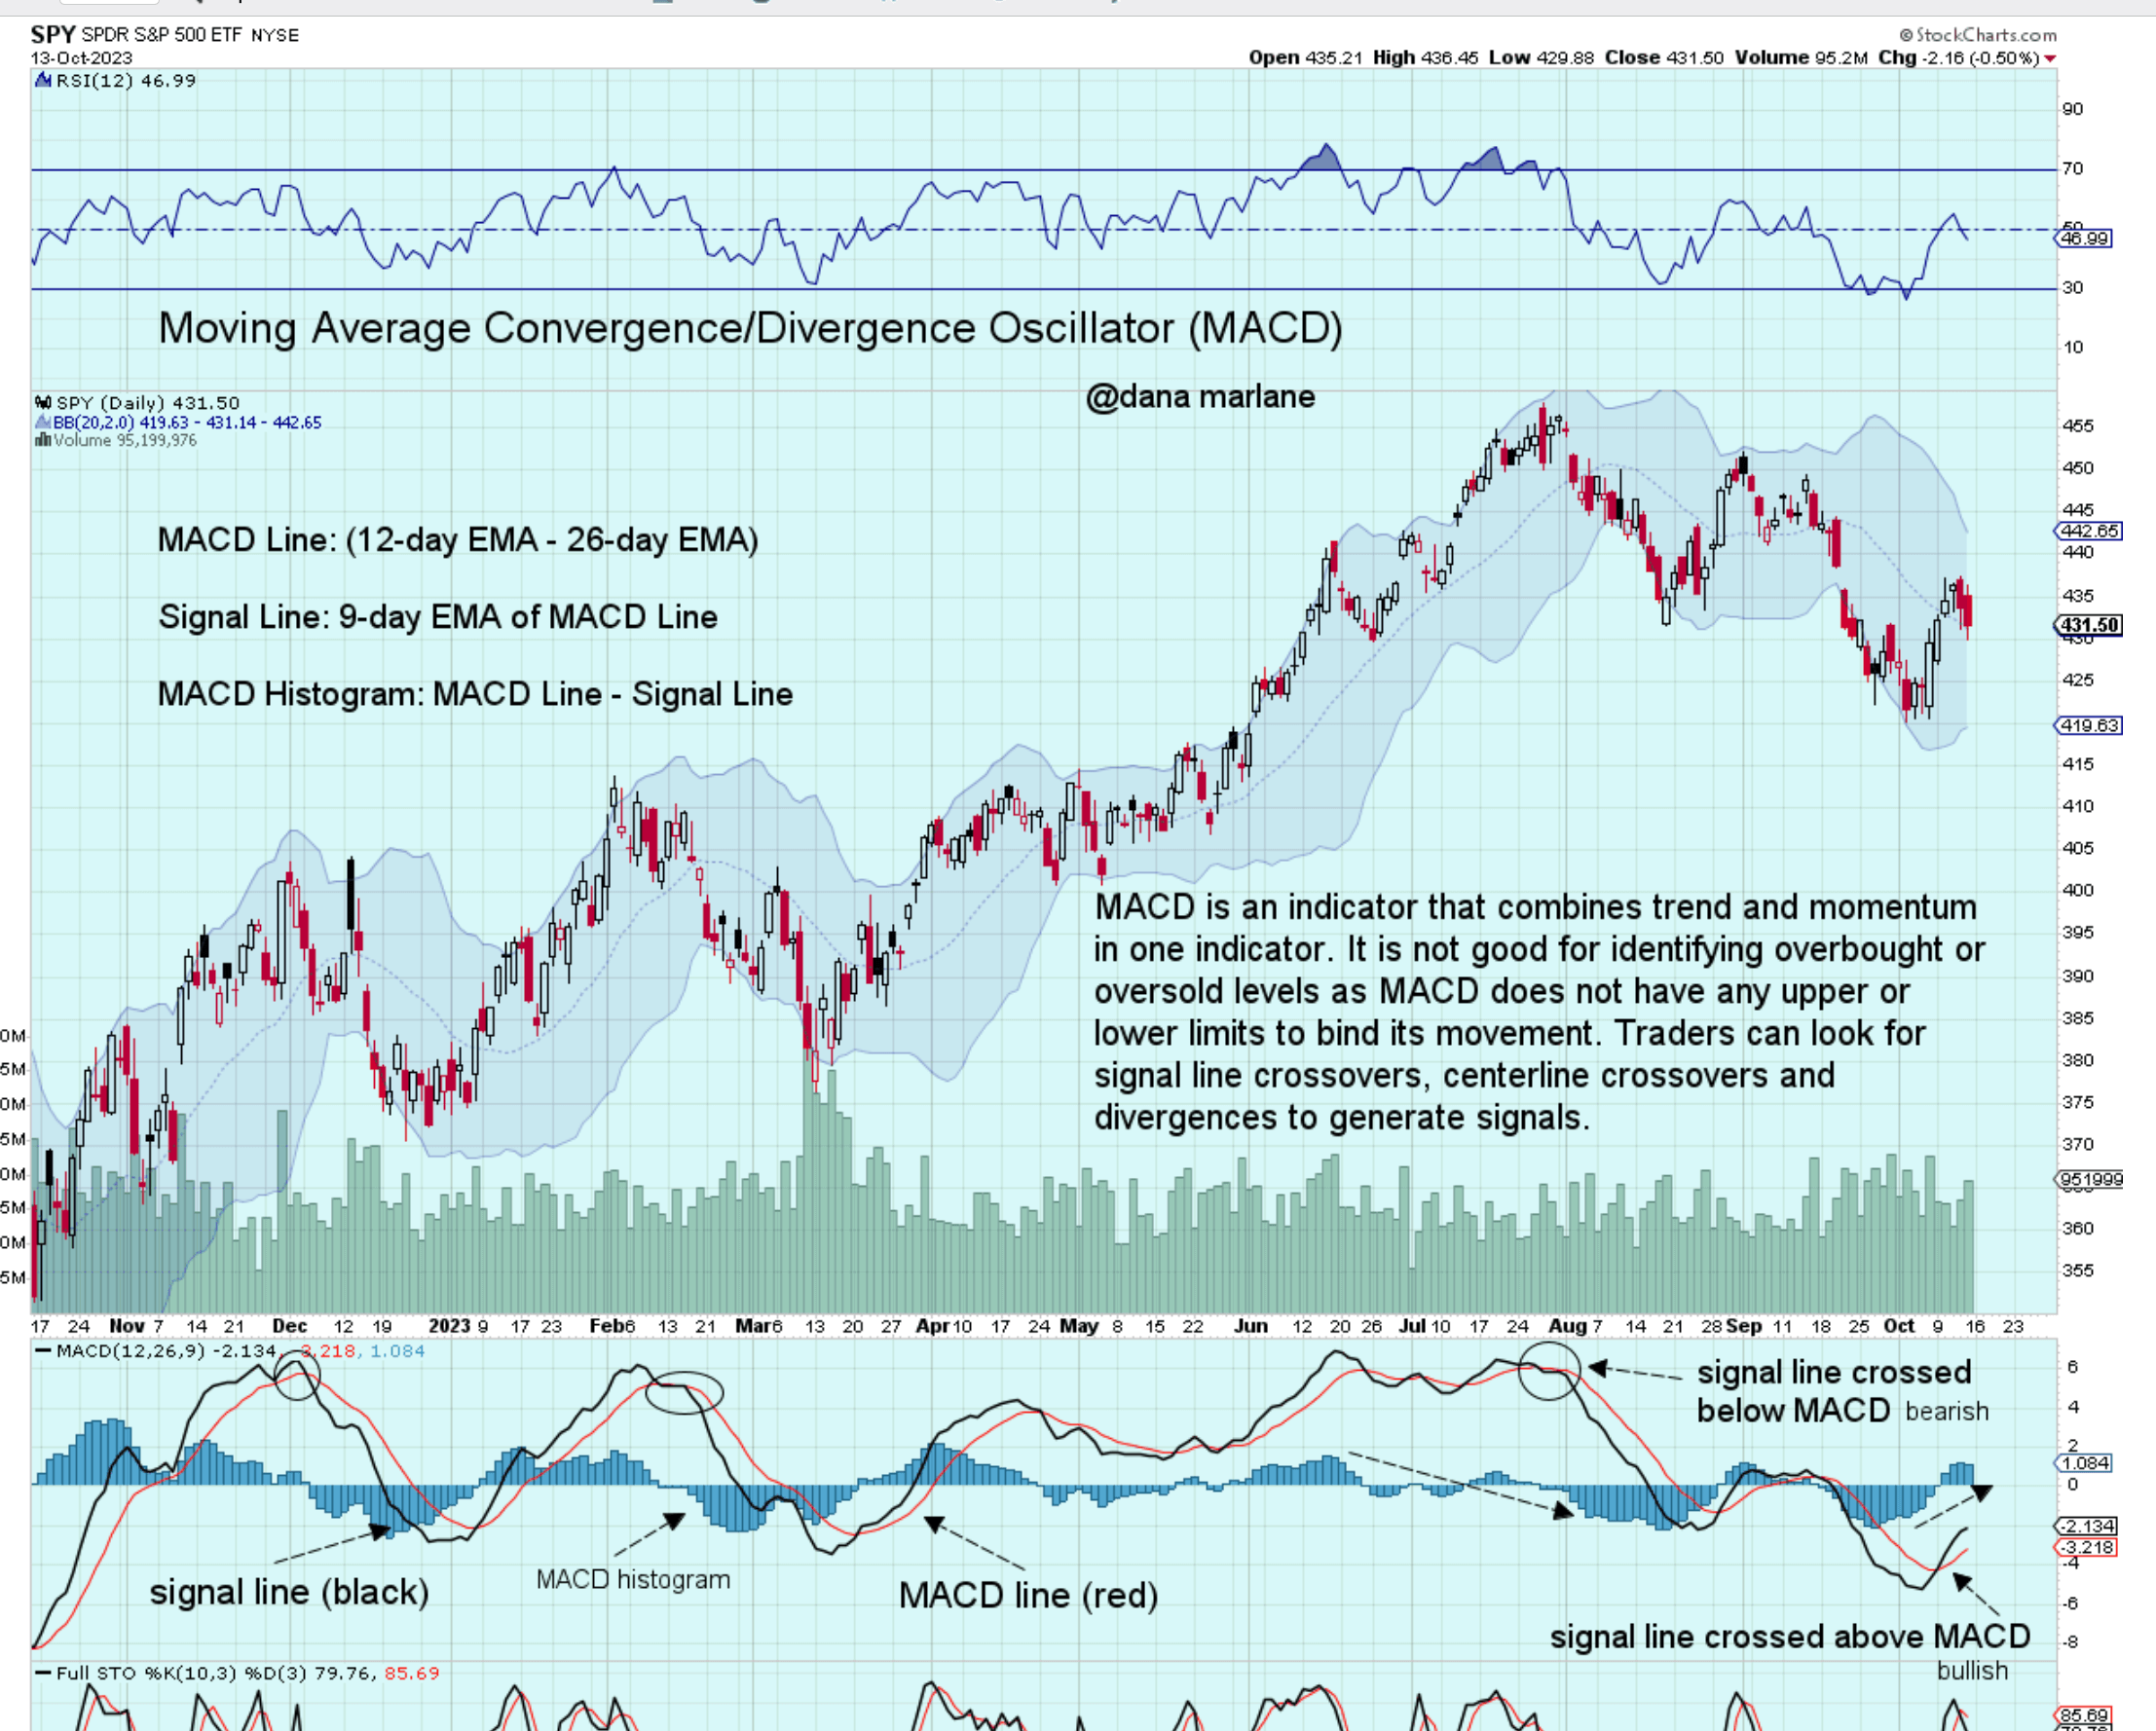
Below are a couple of charts I grabbed from Stockcharts.com. They have an entire page about the MACD indicator and I’d encourage you to take a look at it to learn more.